In my last post with Measures of Central Tendency I mentioned Inter Quartile Range and I wanted to show you just how we use those numbers and what they mean.
We use our Measures of Central Tendency to find the IQR Inter Quartile Range which is a measure of statistical dispersion, being equal to the difference between the 75th and 25th percentiles, or between the upper and lower quartiles. We use a Box and Whisker Plot as an explanatory data analyses, its basically a type of graph that shows spread/distribution of data. Using our data from Grab a Handful Activity we are going to continue to analyse data by making a Box and Whisker Plot.
The first thing we are going to do is order the data from least to greatest and make a number line with that range from the least to greatest numbers.
Now we need to find the Median (middle number) (also know as Q2). We know from our Measures of Central Tendency the Median is 10 so we are going to draw a line to represent the Median.
Median is showed in pink. Also is Q2
Add Ordered Data #'s 235 and divide by 22 to get Mean
Next we are going to make draw 2 lines that represent the Minimum = MIN and Maximum = MAX
Min and Max lines then we will complete the box.
Now we need to find the Lower Quartile and we do this by looking at the data on the lower half below the median which is 7 7 7 8 8 9 9 10 10 10 10. We take these 11 numbers and do the same to them as we do when finding the median of the whole data set to find the middle number and that would be a 9. The #9 is Q1 the 1st Quartile. We do the same to find the Upper Quartile but use the numbers 10 11 11 11 12 12 13 15 15 15 15, the middle number is a 12. The #12 is Q3 the 3rd Quartile.
Q1 and Q3 are shown in Blue and box is completed
The Box and Whisker Plot shows the 5-number summary: Minimum, maximum, median, lower and upper quartiles. The next picture shows how it is divided into Quartiles and will show that in Orange with percents written.
Most of the class picked between 7 and 10 within the 1st 50% of data set
Take #2 I did not have forethought during this activity to take pictures this time around which really bothers me but they are included in my previous Grab a Handful post earlier in my blog. One thing I would like to point out as our class grabbed handfuls of Unifix blocks no one felt the need to grab huge amounts so we didn't have a huge gap in outliers. Now, you ask what is an outlier? I'll get to vocabulary in just a second so this all makes sense. Measures of Central Tendency is a summary statistic that represents the center point or typical value of a dataset. The measures indicate where most values in a distribution fall and are also referred to as the central location of distribution.
A dataset is a collection of data and today we collected data by grabbing a handful of Unifix blocks. We then counted each individual person's blocks in class and compiled our data to come up with our Measures of Central Tendency.
A Math Manipulate Unifix Blocks at Lakeshore
We had a total of 22 students participate in the activity and each student grabbed a handful, the total number of cubes grabbed were 235. Now we need to find our Measures of Central Tendency which are Mean, Median and Mode but first let me define them so our understanding is clear and we can then find our measures.
Mean also called the average, the mean would be the average of all blocks grabbed.
Median is the middle value(s) of data set when ordered least to greatest. 1/2 the data is above the median and 1/2 the data is below the median.
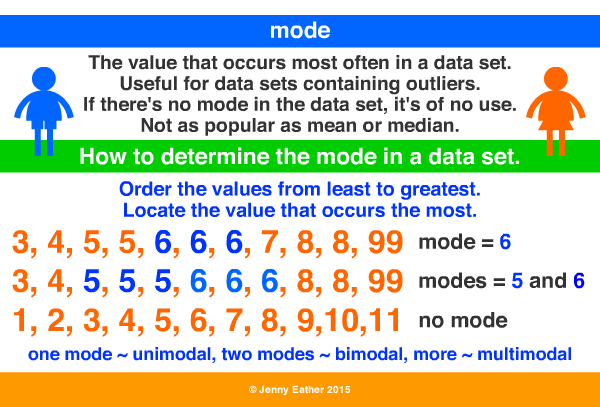
Mode is the most frequent occurring data point in the set of grabbed blocks.
We can see most people grabbed 10 blocks over any other amounts of blocks grabbed and therefore since 10 is the most occurred it will be the Mode of this data set.
The Median is the middle value when ordered least to greatest and because we have 22 participants(you cross off numbers at each end of data set til you get to the ones in the middle) we had two values, when this happens we add the two together 10 + 10 and we get 20, we then divide by 2 (because there were 2 #'s) and we get 10. The Median of this data set is 10.
Now to figure out the Mean which is the average of all Unifix Blocks grabbed we are going to add all blocks grabbed 7+7+7+8+8+9+9+10+10+10+10+10+11+11+11+12+12+13+15+15+15+15 = 235, we then take 235 and divide it by the number of participants which is 22. 235/22 = 10.7 (rounded)
The Mean of this data set is 10.7.
Mean = 10
Median = 10
Mode = 10.7
Range = 8
To find the Range of data set you take the Max # of grabbed blocks and Min # of grabbed blocks and you subtract them. Our max was 15 - 7 our min and that gives us a Range of 8. (15 - 7 = 8)
Now to answer your question what is an Outlier? An outlier would have been a number like say if someone grabbed 24 blocks, it is a number that lies distant from our max #15. Had someone picked 24 that would be our max # but would be an outlier for it sat a distant from most of our data set. Outliers tend to throw off the numbers of the mean. An outlier is a point which falls more than 1.5 times the Inter Quartile Range above the third quartile or below the 1st quartile. Now there's some words you've never heard before and that will be vocabulary for another day because that is a whole other story and lesson.
Here is a movie on Math Antics describing everything I just went over
I love Math Antics, if you have never seen it I suggest you check it out because it has some great resources for teachers! I love ROB, he does a fantastic job explaining simply!
The following charts I found by looking around A Maths Dictionary for Kids site this is an AMAZING site. You are allowed to print out all pdf's to use for educational purposes and they have a little of everything. The pdf's are nicely illustrated and explained in a way everyone should understand. I think this is a huge resource and I'm happy to have found it, even for my own use.